Tidewater Inc. TDW. Stock analysis and Forecast. Last Price $50.19(+0.08%) 05-27-2014
Hi Everybody. Today this stock has drawn a doji star. So it´s probably that TDW will bounce in the next sesions.
Let´s see some fundamentals.
During 2013 the Sales growth was a +15.35%.
The average (4 years) was:+5.84%
On march the company reported an EPS=0.85 better than expected (0.61 was the forecast).
This stock has a P/E ratio of 17.67
Let´s see the chart.
Supports and resistances:
S1:$48.36 S2:$49.88 R1:$52.93 R2:$55.11
As you can see on the Chart, the price is moving inside an uptrend Channel.
Today, the curve has finished the Elliot´s waves flat pattern. And in the next sesion it´s probably the stock begin the 1st wave (uptrend serie. The last earnings report were great so in my opinion this stock will go up soon.
Let´s see some technicals.
The MACD is above zero and below the signal (very close).
The RSI is at 51%. Even with the fall of the last 3 sesions.
The stochastic is in the oversold zone and will bounce soon.
The buy range for this stock is [49.53;50.61]. Actually the stock is inside this range, so I recomend to buy it.
The actual targets are:
Tg1:$52.80 TG2:$53.85 TG ext:$56.01
And that´s all!. Please remember to click on some ads before you leave. It´s important to maintain this blog! Thank you. :)
LinkedIn Corp LNKD. Stock analysis and forecast. Last Price. $155.91(+0.03%) 05-27-2014.
Hi Everybody. I would like to talk about LNKD and its descent into the abyss. The last earnings report wasn´t as well as expected and the stock is deflating.
Let´s see the Chart.
Supports and resistances:
S1:$136 S2:$113.21 R1:166.12 R2:194.31
The price is moving inside a downtrend channel.
The MACD is above the signal and close to zero with an uptrend angle.
The RSI is at 49%.
Actually the Stochastic is inside the overbought level so it´s probably that the price will correct soon.
During the last sesion the price drew a doji star.
The buy range for this stock is [144.34;151.35]
And the actual targets are:
TG1:$159.68 Tg2:$164,84 TG ext:$173.17
Nowadays the price of this stock is stabilizing the strong fall.
Elliot waves. Actually the price has finished the flat pattern (downtrend serie) In my opinion it´s probably that the price will extend the flat pattern also a correction.
I recomend to buy inside the buy range.
That´s all!, Please remember to click on some ads before you leave this blog. It´s important in order to maintain it. Thank you!. :)
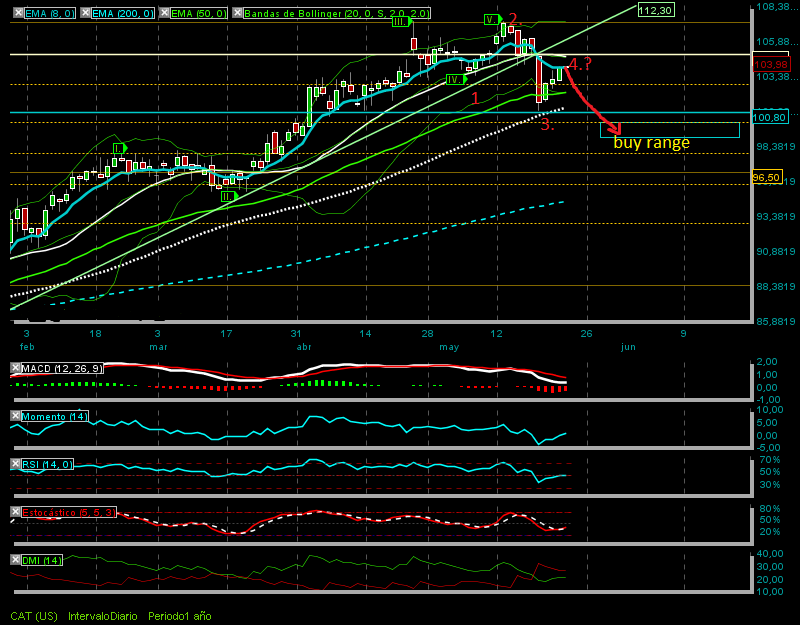
Caterpillar Inc CAT Stock analysis and Forecast. Last Price 104.03(+0.92%) 05-26-2014.
Hi folks, How you doing?. Today I would like to make a technical analysis of this stock.
Let´s see the Chart.
Supports and Resistances:
S1:100.80 S2:96.50 R1:104.74 R2:109.62
Elliot waves. Nowadays the price is in the flat pattern (upside serie) it was a fail in the 5rd wave. And it´s probable that it begun a downtrend serie just in the top of the 3rd wave I marked in the chart. (actually could run the 4rd wave into a downtrend serie).
The MACD is below the signal but the downward slope is flattening.
The Stochastic is going up at 41% but very close to the %K.
The RSI is at 51%. But the DMI shows us that there´re more down movements than up moviments.
The buy range I calculated is [98.03;99.06]. However it´s probably that the stock go lower than this range. Pay attention to the price action and the MACD!.
Once there I will calculate the targets.
Nothing more I hope this analysis will be profitable to you and Please remember to click on some ads before you leave this blog in order to maintain it. It´s important, please!!. Thank you!. :)
Home Depot Inc. HD. Stock analysis and forecast. Last Price 79.18 (+0.51%) 05-26-2014
Hi mates, This stock is inside a simetric triangle. Last week was fine for this stock, and for the rest of the market too.
Let´s see some fundamentals.
This company has a P/E ratio of 20.05, and an EPS= 3.95.
The Consensus average target price is $89.03.
In 2013 the Sales growth was +5.43% and the averge (4 years) was +4.47%. In my opinion this company has a stable growth. Benjamin Graham would be happy with those numbers.
Lasx year this company had a +25.46% EPS diluted growth in front of a +24.42% average EPS growth (4 years).
Let´s see the chart.
As you can see the price is moving inside a simetric triangle.
The AVG 8 crossed the AVG 14 last week.
Supports and resistances:
S1:75.85 S2:74.52 R1:79.77 R2:80.24
Actually the price is very close to the R1:$79.77.
The MACD is above this signal and close to zero. However has a flat pattern.
The RSI is at 57%.
The stochastic is entering in the overbought line. So it´s probable that this week the stock correct a little bit.
The +DI is loosing strenght.
THe buy range for this stock is [$76.42;$78.41]
Once there the targets will be:
TG1:$80.14 TG2:$82.43
I recomend to wait until the price correct and buy inside the buy range. Pay attention to the technicals!!.
That´s all, Please remember to click on some ads before you leave this blog. It´s important in order to maintain it!!!. Thank you. :)
Sonoco Products Co. SON. Stock Analysis and Forecast. Last Price. $41.36 (-0.17%) 05-22-2014.
Hi mates. I would like to analyze Sonoco Products Co. This company has a P/E ratio of 18.97 and an EPS=2.18 with a dividend yield of 3.09%.
Let´s see some fundamentals:
Sales growth 2013= 1.23%
Sales growth AVG (4 years)= 7.83%
Net Income Growth 2013= +11.79%
During the last year the sales growth of this company was below the 4 years average however the net income growth was nice compared with 2012 ( -9.89%).
EPS growth 2013= +10.99%
EPS AVG ( 4 years)= +10%
As you can see the last year the EPS was above the average.
Let´s see the Chart:
Supports and Resistances:
S1:41.08 S2:40.05 R1:42.19 R2:43.44
The MACD is below the signal and below zero.
The RSI is at 44% in a flat pattern. The RSI crossed the 50% level on May the 15th.
The Stochastic is at 25% flat. In my opinion will bounce soon.
Yesterday the price drew a doji star. Potential reversal.
The stock touched the bottom of the box that this stock has been moving since April the 8th.
I think this stock will bounce in the next sesions.!
Elliot waves: From my point of view the price has finished the flat pattern and will start the first wave (uptrend serie).
The buy range [41.14;41.47].
Actual Targets.
TG1: 42.03 Tg2: 42.65 Tg ext: 43.64
And that´s all. Please remember to click on some ads before you leave this blog in order to maintain it. Its Important!!!. Thank you!. :)
NESTLE SA. NESN. Stock analysis. Last Price.70.50chf(-0.28%) 05-21-2014
Hi mates, This evening I would like to analyze NESTLE, a swiss company.
Let´s see the Chart.
Supports and Resistances:
S1:68.56 S2:66.88 R1:71.98 R2:74.25
You can see on the Chart a great rally of this stock. Actually the stock had reached the top of the 3rd Elliot wave, so it´s time to correct. In fact the price is developing the 4rd Elliot wave.
This stock is inside an uptrend channel and is very close to the top. So we should consider to buy in a point close to the support at least.
Today the price has drawn a doji star however i can´t consider it as a reversal pattern.
The MACD is above the signal but is going to cross it soon.
The RSI is at 61% going down.
The stochastic is going down too. and probably will enter into the oversold zone( after the huge rally).
The DMI: +DI is loosing momentum and in a downtrend.
I recomend to buy this stock in the buy range of [68.62;69.84]
once there you can look for those targets to take profit:
TG1:72 Tg2:74.03 TG ext:76.63
You can help to maintain this blog making a donation by Paypal.but if you don´t PLEASE click on some ads before you leave in order to maintain this site. It´s Important!!!. Thank you!. :)
Electronic Arts Inc. EA. Trading idea and stock analysis. Last Price 34.60(+0.64%) 05-21-2014.
Hi mates. I would like to talk about EA. This stock has a P/E ratio of 1730 and an EPS of 0.02. A very High P/E from my point of view.
Let´s see some fundamentals.
Sales Growth 2013: -5.85%
AVG sales growth 4 years:-0.135%
The stock went up with the earnings report (05-06-2014) the EPS consensus was 0.03 and the EPS was 0.35 ( a 1066.67% more than expected).
Let´s see the chart.
Supports and resistaces:
S1:$32.1 S2:$29.39 R1:$35.64 R2:$38.04
The MACD is going to cross the signal.
The RSI is at 71% overbought.
The stochastic is going up at 53%.
Elliot waves:
The stock is going to draw the abc pattern. There´s a fail on the 5rd wave in my opinion.
The buy range for this stock is [$32.04;$32.53]. I heard that there´re insiders sellig shares of the company, and the sotck seems to be overbought. So I recomend to wait until the price enter into the buy range.
I will analyze again the stock in order to calculate the targets when the price reach the buy range.
Please remember to click on some ads before you leave this blog. It´s important to maintain it!!. Thank you!. :)