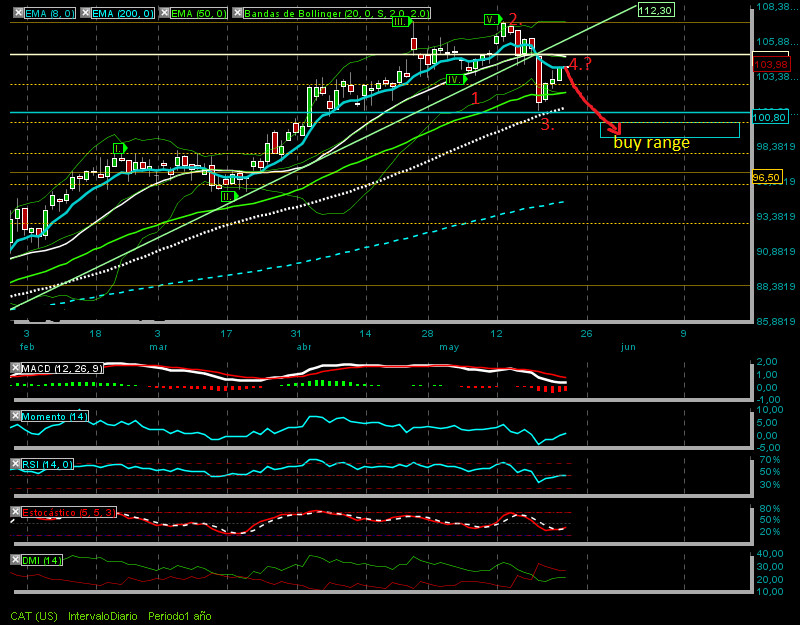
Hi folks, How you doing?. Today I would like to make a technical analysis of this stock.
Let´s see the Chart.
Supports and Resistances:
S1:100.80 S2:96.50 R1:104.74 R2:109.62
Elliot waves. Nowadays the price is in the flat pattern (upside serie) it was a fail in the 5rd wave. And it´s probable that it begun a downtrend serie just in the top of the 3rd wave I marked in the chart. (actually could run the 4rd wave into a downtrend serie).
The MACD is below the signal but the downward slope is flattening.
The Stochastic is going up at 41% but very close to the %K.
The RSI is at 51%. But the DMI shows us that there´re more down movements than up moviments.
The buy range I calculated is [98.03;99.06]. However it´s probably that the stock go lower than this range. Pay attention to the price action and the MACD!.
Once there I will calculate the targets.
Nothing more I hope this analysis will be profitable to you and Please remember to click on some ads before you leave this blog in order to maintain it. It´s important, please!!. Thank you!. :)


No hay comentarios:
Publicar un comentario