AMZN Stock Analysis and Forecast. Last price $288.32 05/09/2014
Hi Everybody. AMZN has a P/E= 450.50 and an EPS= 0.64.
On march the company reported an 0.23 EPS versus the 0.22 consensus forecast.
The financials of this company looks fine, however during the last years the EPS has been falling dramaticaly. In fact last year 2013 the company has been recovered from a negative EPS (-0.09, year 2012).
The average EPS 4 years= 1.61
Last year 2013 = 0.59
Let´s see some technicals.
Supports and resistances:
S1:$288.1 S2:$270.69 R1:$310.47 R2:$337
As you can see on the Chart the price is moving into a downtrend channel. Actually the stock is near the S1 support.
The mMACD is in a downtrend movement at 30%.
The RSI is at 32%. I can think that it´s probable the stock will bounce, however in the past the RSI´s stock arrvived at 23%. So we have to take care about it.
Elliot waves. Actually the stock is going to the V wave and then it will start the flat pattern.
The buy range is [277.19;289.26]. The Price is now in this buy range, however I recomend to wait until the price has finished the V wave movement. I recomend to buy near 280$ aprox.
Please remember to click on some ads before you leave (It´s important) in order to maintain this blog. Thank you. :)
Facebook Inc. FB Forecast review Last Price $56.76 05/09/2014
Hi Everybody. Today I want to review a forecast I made on April.
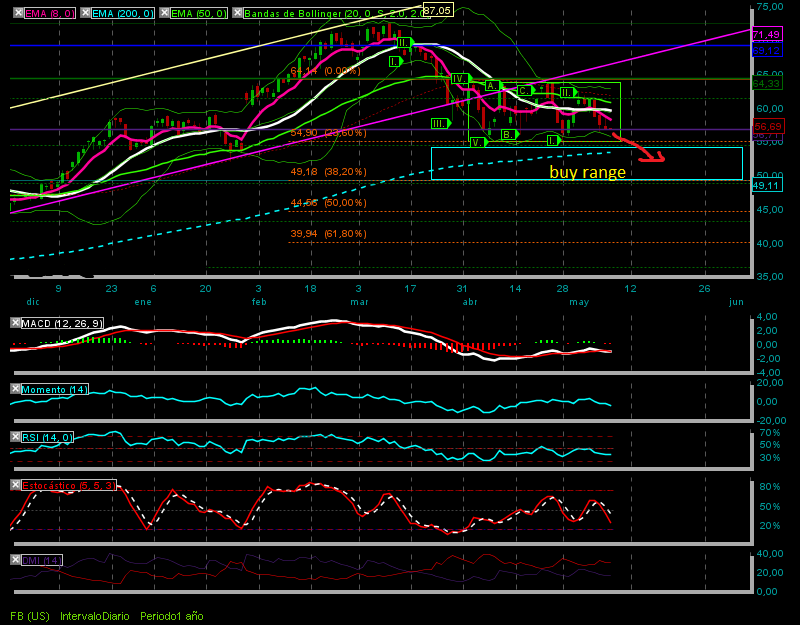
Actually, the price is inside the buy range so I want to make another analysis, in order to find out if today we have the chance to buy or would be better wait for a lower price.
Let´s see the technicals:
The MACD is below zero and below the signal which was corssed recently.
The RSI is at 41%.
The stochastic is going down at 45%.
As you can see on the Chart the price has been moving inside a box (The elliot waves flat pattern) and now in my opinion is developing the 3rd wave (downtrend serie). So it´s probable that the price will go lower. I have recalculated the buy interval because today we haven´t the same scenario that we had on April.
buy range [49.18;54.33]. Those are the prices that I recomend to buy. The middle point is $51.75
When the price reaches thoser levels I will establish the targets.
Today I can´t recomend to buy this stock. I reomend to wait until the price enter into the buy range at least.
Please remember to click on some ads before you leave in order to maintain this blog, Thank you!. :)
NFLX Analysis and Forecast Review. Last price $320.54 05/08/2014
Hi Everybody. In the previous analysis I recomended to buy the stock at 319 price level. Today I want to review this analysis. Despite the bounce the stock made the last week, the status of this stock has changed.
Let´s see the technicals.
THe MACD is below zero and very close to the signal. It´s probable it will cross the signal in a downtrend.
The RSI is at 40% with a flat pattern.
The stochastic is going down at 55% level.
The DMI: -DI= 36.47 +DI= 20.41
Let´s see the chart.
As you can see on the chart the price is running in a downtrend channel. I have noticed that the stock is now developing th 3rd Elliot wave in a downtrend serie. So it´s probable the price will go more lower in the next sesions.
I have established the buy range between 281 and 297.
Once the price has come to this levels I will recalculate the targets.
I recomend to wait. I am expecting a correction.
Please,remember to click on some ads before you leave in order to maintain this blog, thank you!. :)
CSX Stock analysis and forecast. Trading Idea. Last Price $27.98 05/07/2014
Hi Everybody. Today I weant to talk about CSX. This company is a transportation supplier.
Let´s see some fundamentals.
CSX is now rolling with a P/E= 15.54 and it has got an EPS=1.80
During the last two years this company has decreased its sales growth dramaticaly. Let´s see the numbers:
Average sales growth last 4 years= +7.45%
Last year 2013= 2.30%
year 2012= 0.11%
The net income growth for this company in 2013 was 0.27% compared with a 2.03% in 2012.
Let´s analyze the Chart:
The price is now developing the V Elliot wave inside a downtrend serie. As you can see the price is moving inside a box in a flat pattern. The price broke the upside trendline in the last 3 sesions. And it´s pribably the stock will probably go lower thant today.
The MACD is below zero and below it´s signal in a flat pattern.
The RSI crossed the 50% level on April the 24th and is bouncing at the 50% level in a downtrend. Actually is at 46% in a flat pattern too.
The Stochastic is flat in the Day Chart however if you see the weekly Chart the stochastic is going down.
Despite the stock drew a bullish engulfing pattern during the last sesion I can´t recomend you to buy this stock.
My recomendation is to wait until the price reach the buy range of [26.01;26.83] Near the first support level. Actually the stock is near a resistance.
Supports and resistances:
S1:26.83 S2:25.79 R1:28.33 R2:29.17
The targets once the stock will reached this buy range are:
Tg1:$28.46
Tg2:$29.12
Obiously we would make another analysis when the stock reach the buy range.
Please, remember to click on some ads before you leave this blog in order to keep it running, thank you :)
WEEKLY FORECAST HORSES AND CRABS. May From 5th to 9th.
Hi Everybody, This is my stock´s forecast for this week. On the left you can see the stocks I think will go upper than last friday (HORSES) and on the right you can see the stocks I think will correct this week (CRABS).
HORSES
BIIB: In the last sesion the stock went down. The stochastic is near the oversold zone, so it´s probably the stock will raise above the 290 this week.
CIEN: Stochastic at oversold level too, and in the last sesion the price draw a doji. I hope the stock will reach above 20.50 this week.
AMZN: Is know recovering from a gap and the price touched the support last week. I hope the stock will go up at the begining of the week. Then it´s probably the stock will correct again.
CRABS.
APPL: It was a nice horse during since the company published it´s quarter´s results. However In my opinion will correct this week. It´s overbought. In the latests sesion the looks like it´s exhausted.
KFY: I think the price will correct but I expect the correction at the half of the week. In the begining the stock should go up.
ATVI: It was a Doji and a bearish engulfing pattern in the last two sesions. It´s probabaly the stock will correct soon.
An that´s all. I want to review this forecast if I have the time.
And remember if you like this blog please click on the ads before you leave, in order to maintain this blog. Thank you. :)
WEEKLY FORECAST FROM 05-05-2014 TO 09-05-2014.
Hi Everybody. With the Friday´s job report I hope the COMPOSITE will go better than the latests weeks. However I think it´s important to analyze the Chart. It´s a shame that the Ukranian crisis is increasing. I wonder Why they don´t make a democratic elections?. In my opinion once they have the results they have to respect the democratic decision, Both sides. It would be better than a civil war...
We can see the investor´s fears in the Chart.
Let´s see the technicals:
S1: 3.965 S2: 4.017 R1: 4.180 R2: 4.283
As you can see, the point is near to the .382 Retracement. I can see an small triangle formed from the second point of the double ground.
The AVG´s are very close so it´s probably we will see another little correction soon. From my point of view the composite will go up among the begining of the week and then it´s probably a little correction.
It´s probabaly the curve bounce form 4165 with a support in 4.094. I hope the curve will go above the 4150 for the end of the week.
The MACD is above the signal and below the zero with an uptrend direction.
The stochastic is at 75%.
And the RSI is at 48% in a flat pattern.
Some videos playing the electric guitar:
A little blues. And one song from my favorite guitar player.
Please remember to click in some ads before you leave in order to maintain this blog, You can donate by Pay-pal too. Have a nice weekend. :)
CIEN Stock analysis and Forecast. Last price $19.27 05/01/2014
Hi everybody. Today I want to analyze CIEN. As you know This company provides communications networking equipment, software and services.
Let´s see some fundamentals.
The average sales growth for the last 4 years was +37,29%.
Sales growth 2013= +13.56%
The EPS from 2009 to 2013 are in red. However I have to say that is increasing.
Average EPS Growth (4 years)= +39,62%
EPS Growth 2013= 42.76%.
The consensus average target price= $28.75
Let´s see the Chart.
Supports and resistances:
S1:19.01 S2: 17.07 R1: 22.47 R2: 24.12
The price is arriving at the V Elliot wave (downtrend serie) and will begin the flat pattern.
The Macd is flat close to the signal and below zero.
The RSI is at 36%
The Stochastic is penetrating into the oversold zone.
The -DI is above the +DI.
The buy interval is [18.86;19.56].
The targets at this moment are:
Tg1: 20.86 +8.25%
Tg2: 22 +14.16%
TgExt:23.83 +23.66%
That´s all, Have a nice weekend! and remember to click in some ads before you leave in order to maintain this blog, you can donate via pay-pal too, thank you! :)